Table of Contents
Candlestick charts are presently the most often used method of charting in most financial markets, including, of course, digital assets. However, these charts, which feature a variety of and frequently intricate patterns, can be difficult to read and analyse.
A rudimentary awareness of how to read and recognise these patterns, on the other hand, can provide traders with price action information to help them plan their future movements. Therefore in this article, we will be looking into a beginners guide on How To Read Candlestick Cryptocurrencies and some important crypto patterns a trader should be aware of.
What Is A Candlestick Chart?
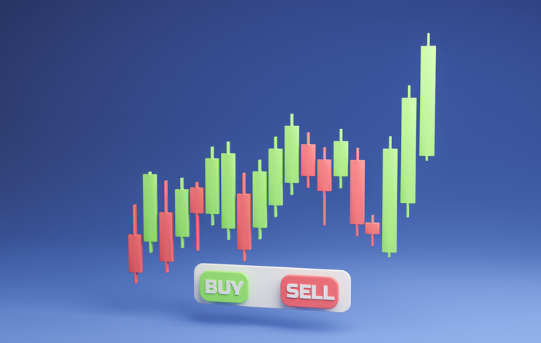
 Traders use candlestick charts to depict the price movement of an item. While candlestick crypto charts are more difficult to grasp at first, they provide significantly more information than a conventional line chart. Candlesticks are important in trading because they display four price points of open, close, high, and low across the time period specified by the trader.
How To Read Candlesticks Crypto?
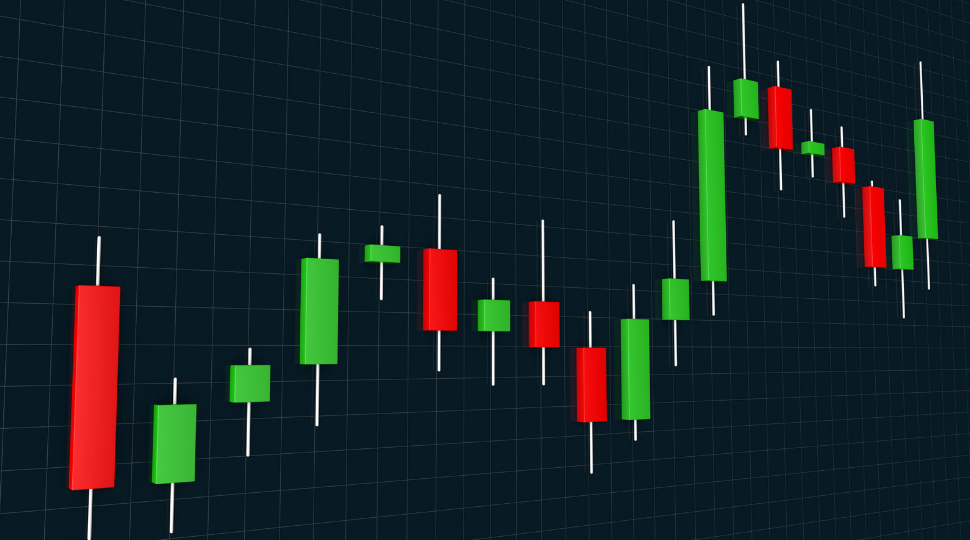
The candlestick features a broad section known as the “true body.” This genuine body indicates the price range between the opening and closing of trade on that particular day.
As can be seen below, there are two candlesticks, and when a candle is red, it implies that its closing price was lower than its initial price. The opening price is the price of the asset at the start of the trading business. Similarly, when a candle turns green, it refers to the closing price being greater than the initial price thereby, indicating the growth asset’s price.
- The body of the candlesticks represents the difference between the closing and opening prices.
- Wicks are sometimes known as tails or shadows. They reflect an asset’s peak and lowest price throughout the candlestick period. If no wick is present, the starting and closing prices are the lowest/highest prices.
- The highest price transacted throughout the time is shown at the top of the upper wick.
- The bottom of the lower wick is the lowest price transacted throughout the time
- The price at which the first trade occurred within the new candlestick time management is known as the opening price. When the price rises and falls the candle turns green and red respectively.
- The closing price is the final price transacted during the candle creation phase. If this price is higher than the opening price, the candle will turn green; otherwise, it will turn red.
Important Trading Patterns Of Candlesticks Crypto Charts
A candlestick trading pattern is divided into two key trading patterns namely the Bullish and Bearish candlestick pattern. Under each candlestick pattern, there are 6 indicators each.
Bullish Candlestick Pattern
 Hammer – The hammer is among the simplest patterns to identify. This pattern, like a hammer, is formed by a candlestick with a long lower wick near the bottom of a downtrend. This pattern displays strong selling pressure, however over the same time frame, purchasing pressure regained control of the price movement.
Inverted Hammer – The difference between the Inverted Hammer and the Hammer is the lengthy wick much above body instead of below. An Inverted Hammer signals the possible start of an uptrend, with the stopped downturn signalling that buyers may take control shortly.
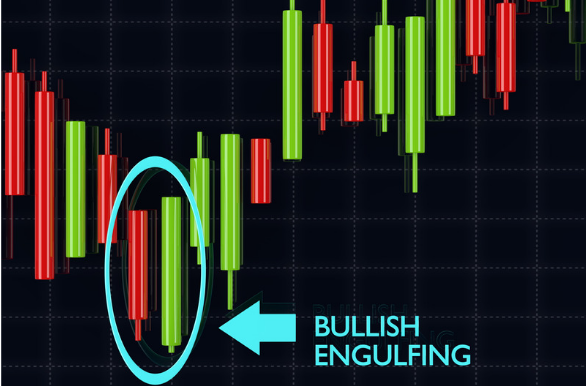
Bullish Engulfing – This trend consists of two candlesticks that appear near the bottom of a downtrend. This pattern signals more purchasing pressure and the start of an uptrend since buyers are likely to push the price higher.
Piercing Line – This is a pattern formed at the bottom of a downturn by a long bearish red candle followed by a long green candle. There is a price difference between the closing and starting prices.
The period’s start appears to be highly bearish. The purchasing pressure, on the other hand, grows throughout the candle, showing that the bulls are interested to buy crypto at the present price.
Morning Star – In a downtrend, the Morning star pattern is made up of three separate candles. The first indicator is a lengthy bearish candle. The second is a star with a long wick and a short body that closes below the previous closing price.
The third candle is a lengthy bullish candle that closes above the first candle’s midway. This indicates if the current trend is losing momentum, which is frequently verified by the third candle initiating an uptrend.
Three White Soldiers – The three white soldiers pattern is formed by three green candlesticks within a downtrend. This shows significant purchasing pressure, which also propels the price higher and may even imply a price reversal on the horizon. The greater the size of the candles, the greater the pressure.
Bearish Candlestick Pattern
 Hanging Man – The bearish equivalent of a hammer is the hanging man. It occurs near the conclusion of an upswing and has a modest body and a lengthy lower wick. This pattern indicates the vulnerability of an uptrend and is frequently interpreted as a sell signal by traders.
Shooting Star – The Shooting Star is constructed with a single candlestick with a tiny body and a lower wick. This pattern, unlike the extremely similar Inverted Hammer, appears near the peak of an upswing. This pattern denotes a severe price rejection following a big price increase.
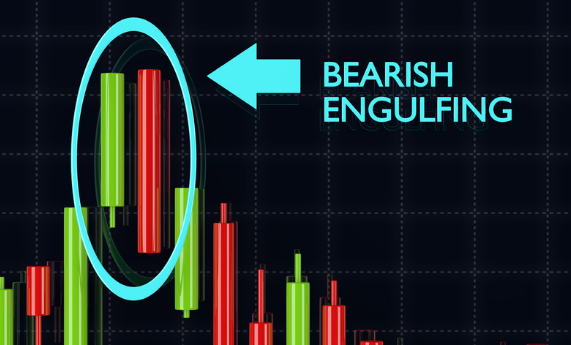
Bearish Engulfing – This design consists of two candlesticks. The body of the second candle is larger than the first. This pattern appears at the top of an upswing when there are gaps between closing and starting prices. This suggests greater selling pressure and the start of a possible decline.
Evening Star – The Morning Star’s polar opposite is the Evening Star. It is made up of three separate candles that are in an upward trend. The star indicates that the current trend is weakening, and traders can exploit it to sell holdings.
3 Black Crows – The Three Black Crows pattern is distinguished by three red candlesticks within an upswing. This indicates a stronger selling pressure driving the price down whilst signalling an impending price reversal.
Dark Cloud Cover – The Dark Cloud Cover pattern is formed by a red candle that starts above the closing price of a preceding green candle but closes below the candle’s midpoint. This pattern might imply a reversal of the present upswing. In this case, traders interpret this pattern as a sell signal.
Conclusion
A candlestick crypto pattern defines a business’s future trends, and every crypto trader should understand and be aware of how to interpret a candlestick pattern, thecryptorobo.com/tr is one of the best platforms to learn all the crypto and other day trading basics and fundamentals. The preceding information on how to read candlestick crypto has been carefully provided to help traders comprehend candlestick crypto and its components in depth.

